Introduction
JALT’s environmental committee was formed in June 2013 with the aim to investigate growing environmental concerns within the organization. We soon discovered that EFL conferences have high carbon footprints but we weren’t sure how high, calculating the precise amount became a difficult and laborious task. Over the past few years, JALT has estimated the footprint at their two main conferences, the PanSig conference in May and the November International conference.
But where did we start? Having looked at several carbon footprint calculators, we choose myclimate. They also offered advice about donating our environment levy and were happy to field any questions we had. Our major problem has been gathering the required data, details of which you can see in the following section. It quickly became apparent that as we gathered more information, our estimates were growing at an alarming rate. Understanding the figures and their relevance to climate breakdown can be daunting. However, it’s worth it as the footprint both demonstrates the impact our industry has and, hopefully, inspires us to find ways to reduce our footprint, in turn making life easier for future generations.
You will see from our calculations that achieving a net-zero conference in the near future will require collaboration from the various stakeholders involved; presenters, publishers, caterers, venue and hotel operators. However, it is those of us who attend conferences that must force change.
We choose to use myclimate for our carbon calculations, however, there are several other online carbon calculators available that are useful at covering other areas. The carbon footprint calculator, for example, helps to compare the footprint for public transport ( which is not included on the myclimate calculator) and flying.
2019 JALT International Conference Carbon footprint
Entering data may seem a relatively easy process, however, we found it is necessary to double check each step. Even though myclimate’s calculator is easy to use, it can be time-consuming as it is necessary to gather and add all the data for each estimate.
It is possible to work out the footprint with four items: the location, duration, number of participants and the number of employees at the event. Student volunteers or interns are an important part of our conferences but we weren’t sure if they should be counted as participants or employees. We chose to include them as participants as they play such an important role. The number of employees and area used was available from the conference site. Entering these details gave us our initial estimate, however, as we found more data, figures changed drastically. The number of participants are available from registration. However, figures such as hotel rooms or vegetarian meals consumed are more troublesome. We used the results of our post conference survey (which was answered by 15% in 2018) and information from our registration pages about home city and mode of transport. We would like to express our thanks to JALT’s main office who have collected data from the conference sites.
If you are looking to calculate the footprint for your conference, these questions may help:
1. What is the size (in square metres) of the rooms that will be used during the conference?
2. How many employees will be used by the venue in conjunction with the event?
3. What electricity supplier do they use? Do they use green energy?
4. What is the air conditioner temperature?
5. Does the venue provide trash bins?
6. Does the venue dispose of the trash? Is it recycled?
7. Are there any drinking fountains at the venue?
Data was input in the following categories
General Name, event duration, country, number of participants, number of employees, heated or air conditioned area (m2).This involves further guess work. We were told 6-10 employees would be used per day therefore entered an estimated figure of 32 ( 8 x 4 days). Similarly, we didn’t use all the rooms everyday, so we estimated the floor space based on room occupation.
Mobility How people travelled to the conference: by car, public transport or by air. Air travel includes business class. For the purposes of this survey, we recorded zero for business class.
Accommodation The total number of nights, in 2-3, 4 and 5 star accommodation. We assumed that all attendees stayed at 2-3 star hotels.
Catering This covers food and drink served at the conference.
Energy Energy for heating and air-conditioning is calculated on the amount of floor space used. To calculate this accurately we would need to know overall consumption and if green energy was used. We used average values for this calculation, as the venue couldn’t say if it used green energy.
Materials This includes handbooks ,textbooks, paper and trade stands that are used by conference-goers.
Transport This is an important area not to be confused with mobility. It concerned the materials and other goods transported to the venue. In the case of JALT, that would include SIG (Special Interest Groups) materials, projectors and AM materials. Mobility and transport are the highest contributors to the footprint.
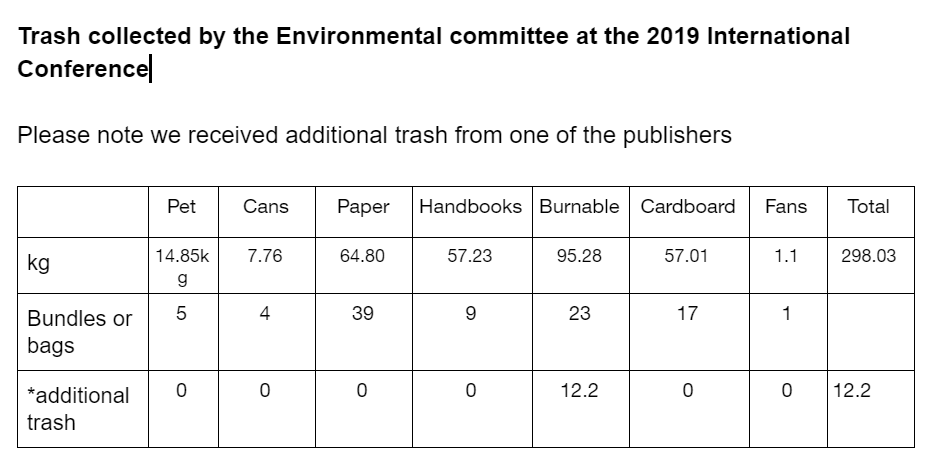
Waste This includes trash collected at the venue. (We can see from our figures that our trash collection and awareness plans are making a positive contribution. More on this below).
Final figures
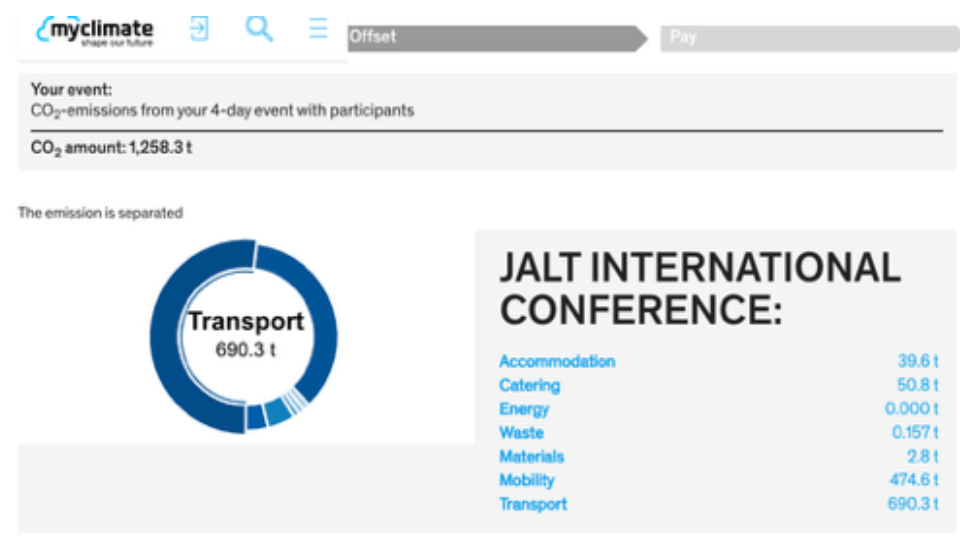
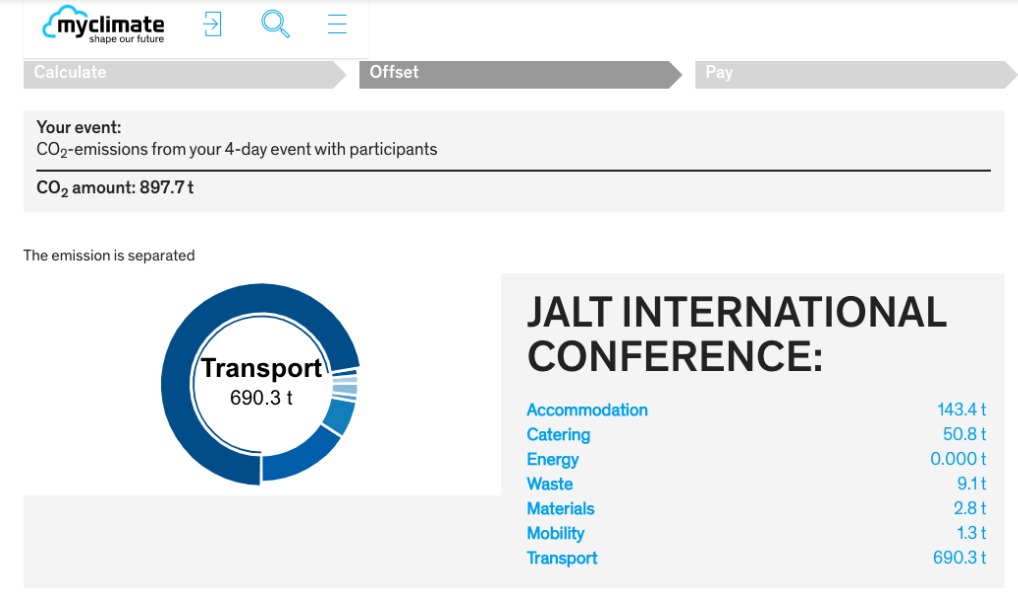
Myclimate calculations estimated JALT’s 2019 International Conference’s carbon footprint to be between 699.4 and 1265.4 tonnes of CO2. However, it is reasonable to assume that the lowest figure would actually be 897.7 tonnes based on the data. (Those interested in statistics may want to look at the various scenarios we used in our calculations.)
A bit more detail
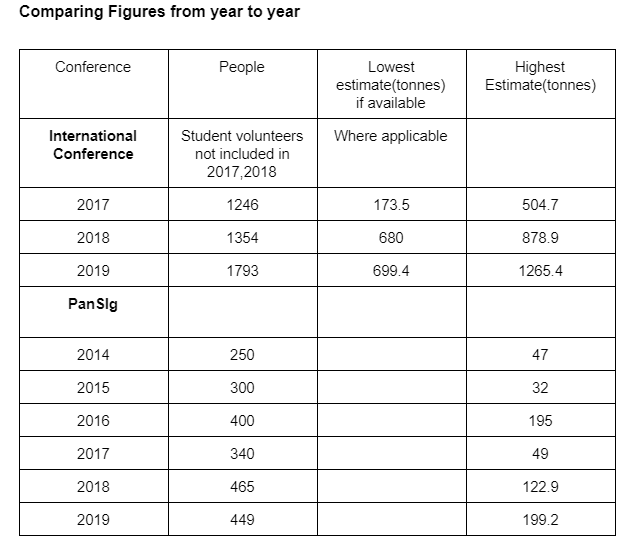
See below screenshots of the highest and lowest estimates as offered by the myclimate calculations and calculations compared by year (these suggest that the carbon footprint has grown year by year, but it actually reflects the fact that we have been calculating it more effectively, and including more factors in the calculations year by year).
How can we use the data to develop environmental initiatives?
You can see there are two areas that have a high impact, mobility and transport, and we need to talk to the publishers and other stakeholders to discuss ways to reduce transport to conferences. Perhaps it is possible to publish more materials online, phase out handbooks or reduce the weight of material transported to the venue. Asking conference-goers to avoid flying is one of the biggest challenges but would greatly reduce our mobility footprint. We probably need to think outside the box in the future.
History
The environmental policies within JALT began informally around since 2013, with members of various SIGs (though initially predominantly GILE – Global Issues in Language Education – SIG) discussing ways that the organization could be more sustainable in its practices. After asking questions and/or sending suggestions to the planning committee of the international conference, the environmental liaison position was added to the PCPC (Pre-Conference Planning Committee) in 2016. The committee made recommendations regarding food/meal preparations, handbooks, conference bags, and trash reduction and began gathering information on the November conference’s carbon footprint.
Examples of these recommendations include: researching and pricing local or sustainable tea, coffee, and FSC cups; sourcing organic cotton bags or t-shirts (for interns, the student volunteers); finding trash cans/bags made from recycled materials; recommending dishware rental companies for social events; sourcing local recycling stations for paper/can/bottle/PET waste; or suggesting regional carbon offset projects for the donations received from conference goers.
The environmental committee was made solely responsible for the trash policies from 2017. That year, we were in charge of placing, monitoring, and emptying bins, sorting waste, and delivering recyclables to a nearby station. Each successive year has seen our involvement expand and improve.
Trash
Dealing with trash for a conference involves juggling a number of things: types of waste the venue wants collected, how they calculate their waste disposal charges, how boxes should be labelled, how things should be sorted behind the scenes, and what recycling companies are nearby. For us, each of the prefectures (political districts in Japan, similar to “state” in the US) have varying rules and restrictions for what can be disposed of as well as how and where. This means that our venues charge for waste removal differently and accept different items. For example, some venues charge by volume, some by quantity of 45L or 90L bags regardless of weight, or others still by weight (in kg). Knowing the details of the venue are absolutely crucial in preparing and implementing a smooth waste management system for a conference.
No question is too mundane or too insignificant. The more information you have before day 1 of the event puts you in a stronger position to respond to whatever wrenches will be thrown your way (and yes, there will always be some) during the conference. Go in with a plan and, as soon as you’re able, get a sense of what is workable for the context. Devising a clear labelling system in the storage areas for sorting will go a long way in achieving this. It will also make it easier for volunteers to pop in and help out! Even when you think you have all the information, it may not go as planned, so plan for the worst and hope for the best.
Labelling trash boxes for each year has involved a great deal of trial and error as signs need to accommodate the venue restrictions while also making it easier for the committee to sort waste. In the beginning, we left it simply as burnable, unburnable, PET bottles, paper, and cans (the first two in this list are unique categories for Japanese waste management).
It became clear from this first year (2017) that better labelling, more categories, and modified receptacles were needed. For example, with our first venue, if paper waste became wet it could not be recycled, thereby becoming burnable garbage. However, simply labelling waste boxes “paper” meant that people with paper coffee cups dumped them (often with liquid remnants) into the paper box, thereby ruining an entire stack of previously recyclable handbooks/inserts/handouts, etc.
The following year (2018), in response to the previous year’s loss of paper, we preemptively received the trash sorting requests from the venue and made bilingual signs accordingly. Great in theory, turned out to not be so great in practice. The reasons were twofold: food was not allowed inside the venue, only in a selected area just outside. As a result, only trash cans outside the venue were labelled to collect food waste. Inside, trash can categories now included “dry” burnable waste (non-food) but these and regular burnable waste were alternated on floors.
The end result? People brought coffee cups or their own lunches into the venue and then had either nowhere to dispose of them or confusingly labelled bins. This, in turn, made for far more difficult sorting behind the scenes as we tried to salvage what we could for recycling while stacking to reduce overall volume (i.e. disposal costs, but more on that later). Furthermore, this meant that we were focused on sorting rather than recruiting volunteers to help or attending the conference for our own professional development. Frustration was expressed by all-conference goers, officers in the organization, and members of our committee. To top it all off, the industrial paper recycler we had found to take out waste in that region informed us after the fact that unlike standard paper recycling schemes, they did take paper that had been wet, as long as it was dried out first. That meant all the paper cups and “ruined” paper could have been salvaged and much of the legwork by the committee to sort was unnecessary. Getting all the information beforehand is key.
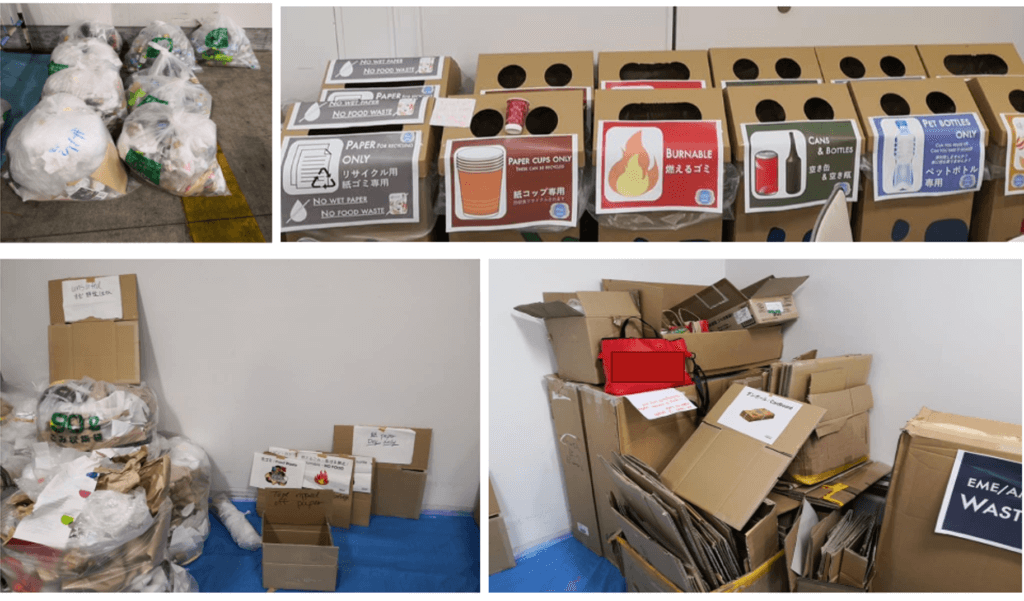
The most recent conference, November (2019), was the first year we can say our waste management was really successful. It was far smoother, despite it being the first time the Environmental Committee was officially in charge of waste in this venue, no doubt because the lessons learned in previous years helped us prepare. The labelling was much more refined: burnable, two kinds of paper waste bins (paper cups only, and paper to be recycled), ( PET bottle, complete with the questions: “Can you reuse it? Can you take it home?”), and cans & bottles (though glass bottles continue to be minimal).
By arriving while our sponsors were setting up, the committee was able to organize the trash area before anything came in. We recycled signs from previous years to identify areas for the sorted waste and what was unsorted. Additionally, there was a more concerted effort in conference PR to highlight the work of the Environmental Committee, encourage conference-goers to reduce their consumption at the event, pledge to take specific sustainable actions, and even sign up to help monitor or sort waste. We believe these initiatives, alone with stricter regulations from the venue, helped us reduce the amount of waste produced and manage everything in a smooth manner.
All of the committee members were able to attend various presentations and received support from the JALT structure -a conference co-chair and the Director of Programs both gave time to help us. Recyclables were dealt with more easily and when the venue management came to pick up the trash, it was all done smoothly and in a timely manner. No mad rush to get out before doors locked! We hope to take the successes of this conference and the knowledge we have gained to our 2020 conference, back at the venue used in 2017. We are optimistic that this experience and increased awareness of sustainable conference practices among the JALT community will make 2020 even more successful in this regard!
Coffee Grounds
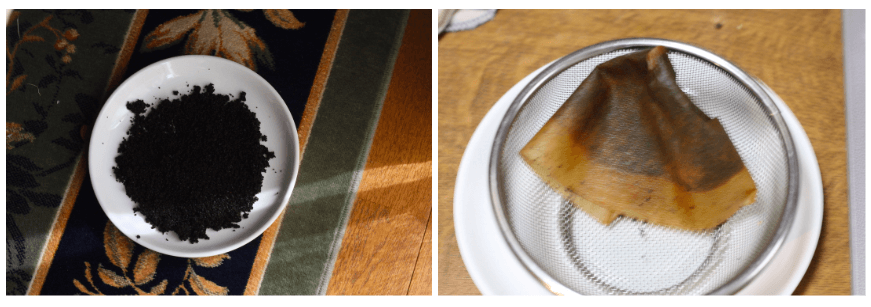
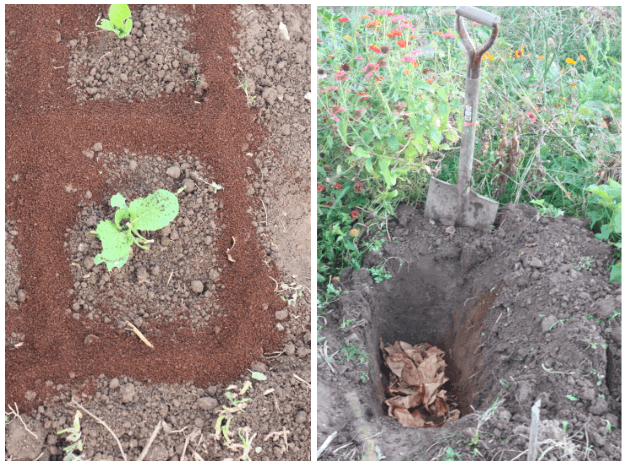
Winc Aichi, in Nagoya, the 2019 venue, is the only venue where we can run our own coffee stand. We probably can’t claim that it was completely environmentally friendly as the coffee grounds and filters were transported to Gifu (45 kms away), but they were put to use in a vegetable garden. The grounds were used as a fertilizer and to absorb kitchen smells, whilst the filters (non bleach) were composted. In the future, with the growing interest in gardening, it may be possible to find a local gardening group to take our grounds. For the record, we recycled approximately 27kg (13 kg when dried) and 76 filters (415 g when dried). One statistic that may be useful was that coffee grounds reduce their weight by 50% when dried.
If you have had similar experiences of calculating the carbon footprint of your event, or if you’d like to and want to ask for advice, please leave a comment!
Jennie Roloff Rothman (chair), Mark Brierley and Brent Simmonds jointly make up the JALT Environmental Committee.